Overview
In this lecture, we describe access costs and cache optimization strategies.
Full lecture notes on storage — Textbook readings
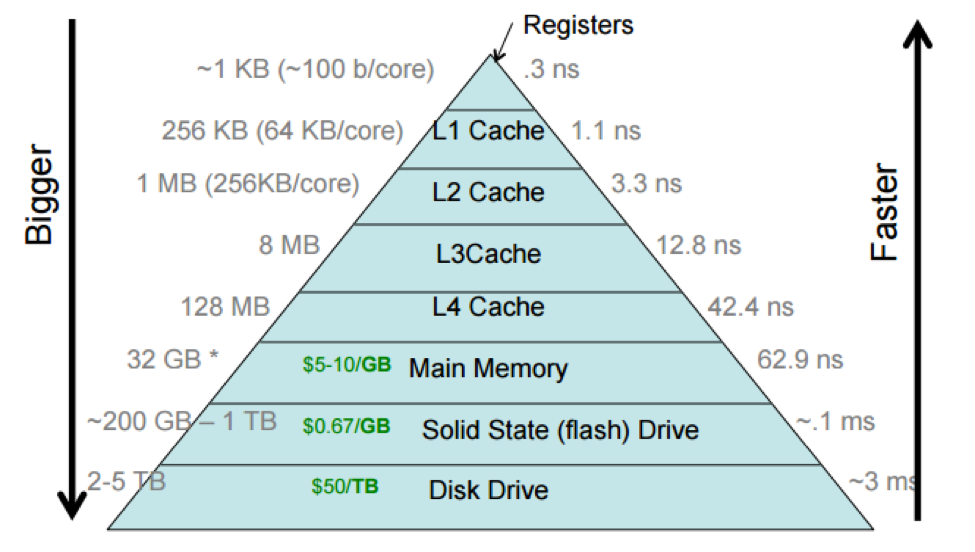
Storage hierarchy
- Modern computer software and hardware orchestrates many different data storage technologies into a unified whole
- Caching is implemented at many levels
- These technologies together are called the storage hierarchy or memory hierarchy
Systems cache examples
- Processor caches
- Administered by: processor hardware (CPU/socket/motherboard)
- Underlying storage: main memory (DRAM)
- Fast storage: cache memory (SRAM)
- Buffer cache
- Administered by: kernel
- Underlying storage: durable media (flash, hard disk)
- Fast storage: main memory (DRAM, physical memory)
- Stdio cache
- Administered by: application library
- Underlying storage: durable media via buffer cache
- Fast storage: application memory
- Browser cache
- Administered by: browser
- Underlying storage: remote web sites over network
- Fast storage: durable media
Expense of storage
- Expense is a major factor in the construction of computer systems
- Faster technologies are often more expensive
- Older, slower technologies are often cheaper
- The relative and absolute expenses of storage technologies may be the single thing about computer systems that has changed the most dramatically over time
Question
- How much more did a megabyte of memory cost in 1955, compared to now?
- How much more did a megabyte of hard disk storage cost in 1955, compared to now?
Historical costs of storage
Absolute costs ($/MB):
| Year | Memory (DRAM) | Flash/SSD | Hard disk |
|---|---|---|---|
| ~1955 | $613,000,000 | $9,290 | |
| 1970 | $1,090,000 | $388 | |
| 1990 | $221 | $8.13 | |
| 2003 | $0.134 | $0.455 | $0.00194 |
| 2010 | $0.0283 | $0.00358 | $0.000108 |
| 2025 | $0.004 | $0.00005 | $0.000039 |
Relative costs (relative to hard disk storage in 2025):
| Year | Memory (DRAM) | Flash/SSD | Hard disk |
|---|---|---|---|
| ~1955 | 15,700,000,000,000 | 238,000,000 | |
| 1970 | 28,000,000,000 | 9,950,000 | |
| 1990 | 5,670,000 | 208,000 | |
| 2003 | 3,440 | 11,600 | 49.7 |
| 2010 | 727 | 91.8 | 2.79 |
| 2025 | 102 | 1.28 | 1.00 |
(Processor speed has also increased a lot—from 0.002 MIPS in 1951 to 750,000 MIPS now—but this is “only” 375,000,000x.)
Access cost framework
- C_N: Cost of accessing N units of data at once (N \geq 1)
- Cost is often measured in terms of time (latency)
- C_N = \infty if it is impossible to access N units at once
- As a rough estimate, many access costs are approximated by C_N = R + NU
- R is the cost per request, independent of the number of units accessed by that request
- U is the cost per unit
Example: System calls
- Consider the cost of a
read(fd, buf, sz)system call - Remember how stdio achieves benefits
- Assume
readroughly obeys C_N = R + NU. Is R > U, or is R < U?
Beyond latency
- The performance of storage is best measured using two metrics
- Latency (delay): how many seconds it takes to complete a request
- Units: seconds
- Smaller latency is better
- Throughput: how many units of data can be moved per second
- Units: bytes per second (or blocks per second, etc.)
- Larger throughput is better
Relationship of latency and throughput
- For some storage technologies, latency and throughput are inverses
- throughput = latency−1
- True random access
- In the cost framework, R=0 and C_N = NU
- For other technologies, latency and throughput can diverge
- For example, some technologies support parallel requests
- Hard disk drive throughput: ~1–250 MiB/s
- Hard disk drive latency: ~0.4–10 ms
- SSD (flash drive) throughput: ~50–3000 MiB/s
- SSD latency: ~30–100 µs
- In the cost framework, R\gg 0
High-latency, high-throughput I/O
Access costs, latency, and throughput
- Assume per-request cost is much smaller than per-unit cost (R \ll U)
- Example: main memory access
- Then C_N \approx NU
- Throughput per unit with N-unit requests = N/C_N \approx 1/U
- Latency = C_1 \approx U
- Assume per-unit cost is much smaller than per-request cost (U \ll R)
- Examples: system calls, reading/writing a disk drive
- Then C_N \approx R
- Throughput per unit with N-unit requests = N/C_N \approx N/R
- Latency = C_1 \approx R
- Assume per-unit and per-request costs are comparable (neither dominates)
- Example: network communication
- Then C_N depends on both R and U
Reducing access costs
- Reduce number of requests
- Avoid redundant requests
- Do the same work in fewer requests
Cache optimizations
- Batching (read or write)
- Prefetching (read)
- Write coalescing (write)
- Parallel access (read or write)
Batching
- Combine multiple requests into one request
- Example: Read 4096 bytes in 1 request, instead of 1 byte 4096 times
- Reduces total per-request cost R
Prefetching
- Read data into a cache before it is needed
- Example: Assume sequential access; read bytes [d, d + 4096)
- Reduces number of requests
Write coalescing
- Delay writes to underlying storage until collecting several writes to cache
- Example: Assume a cache line is updated multiple times
- Think a local variable updated in a loop, or multiple local variables in a cache line updated in close proximity
- Reduces number of requests
Parallel or background access
- Perform accesses in parallel with other work
Question
- How might these optimization strategies hurt performance?
- How might these optimizations change semantics (produce different observable results)?
Exploring performance of file access
w-osbytevs.w-osblockw-stdiobytevs.w-stdioblock
Exploring performance of access patterns
r-osbytevs.r-osbyterevr-stdiobytevs.r-stdiobyterev